
May 12, 2025

MAY 2025 WASDE REPORT SUMMARY AND NOTES:
Today’s report provided the first look at new crop balance sheets and incorporated acreage estimates from March’s Prospective Plantings report. Market attention will continue to focus on developing U.S. trade relations, planting progress and early growing season weather, and subsequent changes to these estimates in future WASDE reports. Today’s report included the following note in the commentary:
NOTE: The WASDE report only considers trade policies that are in effect at the time of publication. Further, unless a formal end date is specified, the report also assumes that these policies remain in place.
Today’s headline numbers were viewed as relatively friendly corn and soybeans relative to expectations. For wheat, the headline numbers were neutral relative to expectations.
Corn
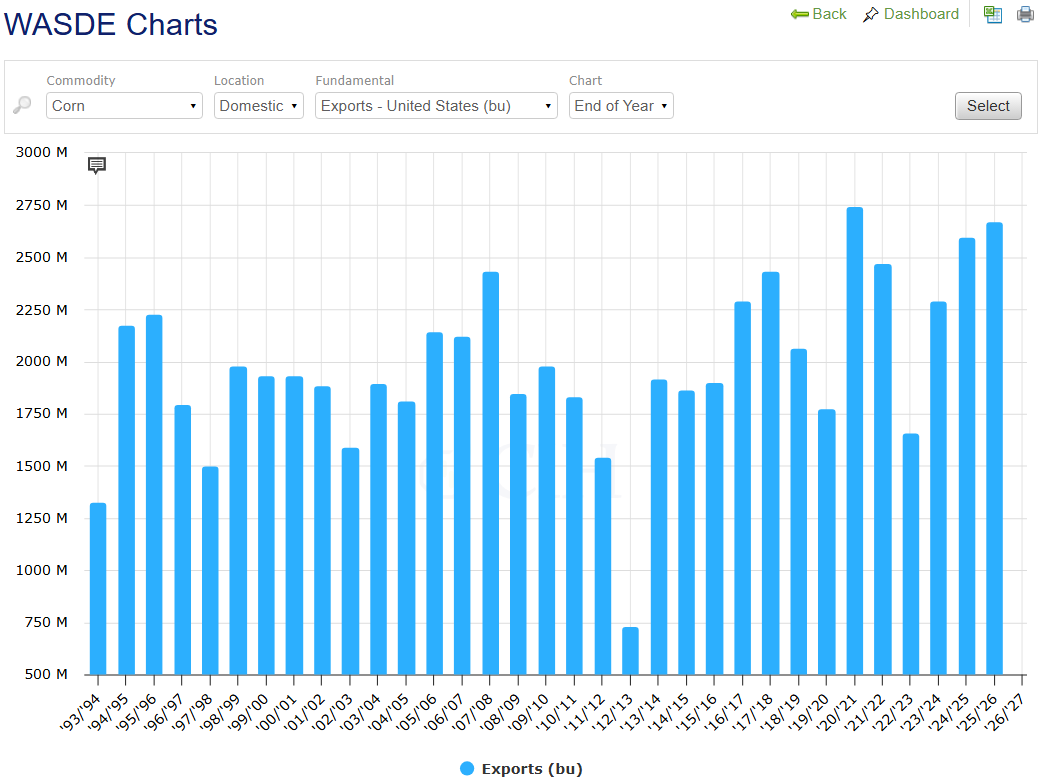
For corn, the domestic 2025/26 balance sheet called for record supplies, use, and higher ending stocks. Production was pegged at 15.8 billion bushels, nearly identical to trade analysts’ average pre-report estimate of 15.799 billion bushels. A weather-adjusted trend of 181.0 bushels per acre was used assuming normal planting progress and summer growing season weather. Total corn use was increased more than 1 percent from the last year. Exports were increased to 2.7 billion bushels as lower prices are expected to attract demand. USDA forecasts the U.S. to be the world’s largest exporter in 2025/26. Ending stocks were increased by 385 million bushels from last year and would be the highest since 2019/20. Domestic ending stocks, at 1.8 billion bushels, were at the low end of analysts’ pre-report estimates (1.800 to 2.260 billion range). Stocks-to-use was pegged at 11.6 percent, up from last year’s 9.3 percent. The global balance sheet called for record production and consumption, as well as a decline in ending stocks. Chinese new crop corn imports were pegged at 10.0 million metric tons, up 2.0 million from last year. Global ending stocks were pegged at 277.8 million metric tons. This was lower than the average pre-report estimate of 296.0 million and below the low end of the range of estimates (279.7 to 308.0 million range). This was down nearly 10 million metric tons from last year. If realized, this would be the lowest global ending stock level since 2013/14.
Corn planted acres highest since 2013/14:

Ethanol usage unchanged for third-straight year:

Corn exports increased for third-straight year:
Soybeans
For soybeans, the domestic 2025/26 balance sheet called for lower supplies, higher crush, and lower ending stocks. The soybean crop was pegged at 4.340 billion bushels, nearly identical to trade analysts’ average pre-report estimate of 4.325 billion bushels. This was calculated with a weather-adjusted trend of 52.5 bushels per acre. Domestic crush was increased from last year by 70 million bushels. Increased pork and poultry production is expected to drive increased soybean meal usage. Soybean oil exports, on the other hand, are expected to decrease from last year on larger global oilseed supplies. Domestic biofuel usage is expected to more than offset this lost demand. Exports were lowered from last year by 35 million bushels to 1.815 billion. The U.S. share of global soybean exports is forecast to fall to 26 percent, down from 28 percent last year. Domestic ending stocks were lowered by 55 million bushels from last year to 295 million. This was below the average pre-report of 351 million bushels but within the range of estimates (265 to 550 million range). Global soybean production was increased by 1 percent from last year as increases in Brazil, Paraguay, Russia, and China offset lower production in North America, Argentina, and Ukraine. Brazil’s crop is projected at a record 175 million metric tons (an increase of 6 million from a year ago) while Argentine production was pegged at 48.5 million tons (a decrease of 0.5 million from last year). Soybean imports for China were increased by 4 million tons from a year ago. Global ending stocks were forecast 124.3 million metric tons. This was slightly below the average pre-report estimate of 125.3 million metric tons but within the range of estimates (120.7 to 133.2 million range).
Soybean planted area of 83.5 million acres would be lowest since 2019/20:

Domestic crush increased based on pork and poultry demand:

Soybean exports to continue trend lower since 2020/21:

Wheat
For wheat, the domestic 2025/26 balance sheet called for an increase in supplies, higher domestic use, lower exports, and higher stocks. Supplies were increased on higher beginning stocks. All wheat production was reduced 3 percent from a year ago on lower harvested acres, although this decrease was entirely due to spring wheat production figures (from 622 million bushels down to 531 million bushels). Winter wheat production was up 2.4 percent from 2024. Exports were projected lower at 800 million bushels as strong competition from major exporters’ is expected to provide a headwind. Projected ending stocks were pegged at 923 million bushels. This was above the upper range of analysts’ pre-report estimates (771 to 920 million range), would represent an increase of 10 percent from last year, and would mark the highest level in 6 years. The global balance sheet called for larger supplies and slightly higher stocks. Increased output was called for in the UE, India, China, Argentina, Russia, and Canada. Projected global ending stocks were pegged at 265.7 million metric tons. This was larger than the trade analysts’ average pre-report estimate of 259.8 million metric tons (250.2 to 271.1 million range). While up 6.9 million metric tons from last year, this remains below the record-high 222.2 million metric tons in 2023/24.
All wheat production lowered from a year ago:

All wheat exports pegged at 4th lowest level in last 30 years:

All wheat food use pegged at record-high:

Domestic ending stocks at highest level since 2018/19:
