July 10, 2026

This report reflected tighter supply for corn and wheat and increased production and use for soybeans, in line with analysts’ pre-report estimates. This report incorporated last month’s Acreage and Grain Stocks estimates into its balance sheets. Market attention will continue to focus on the domestic weather’s impact on yield potential across the U.S. Midwest.
Corn
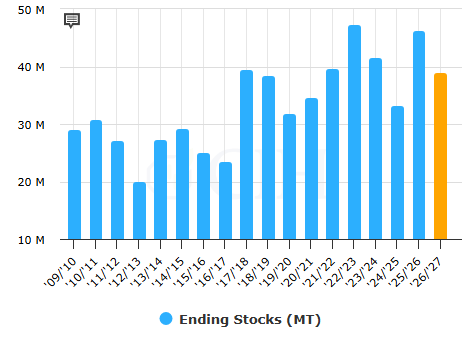
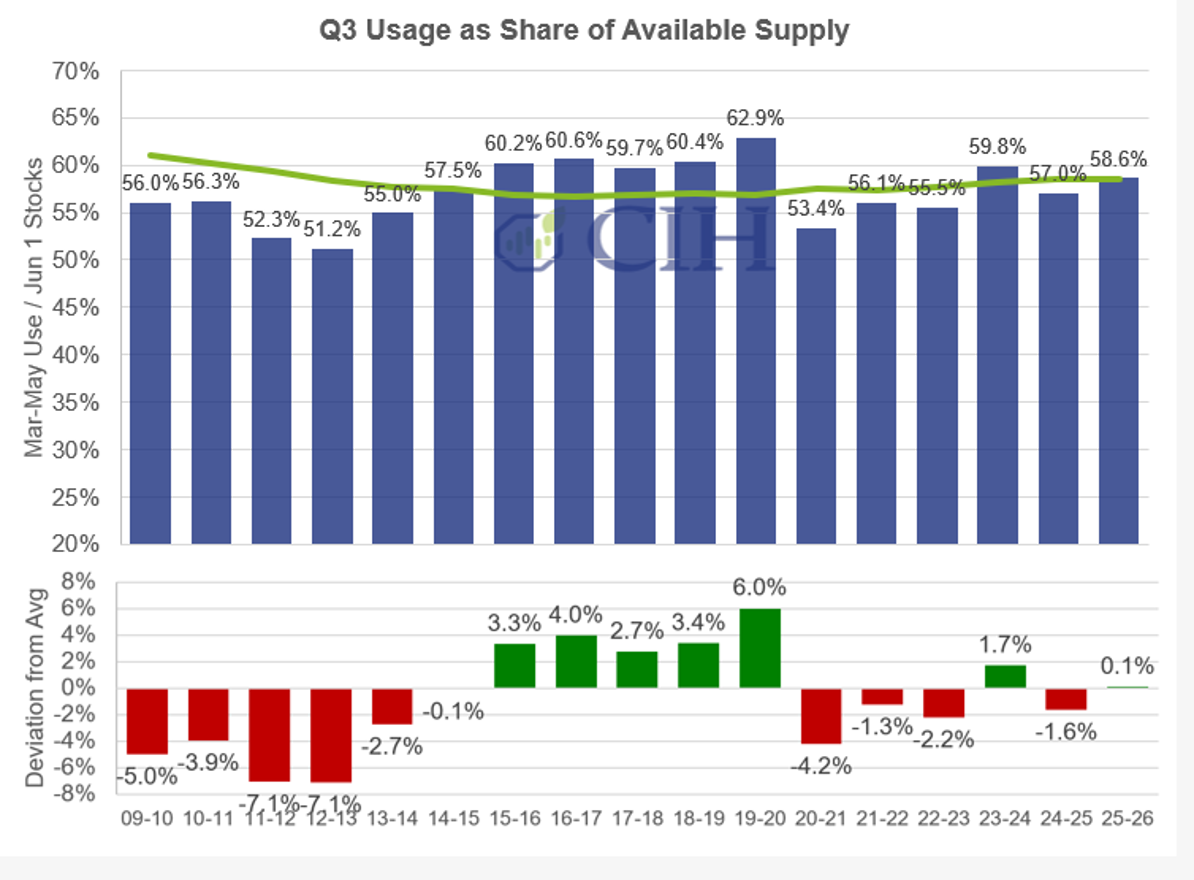
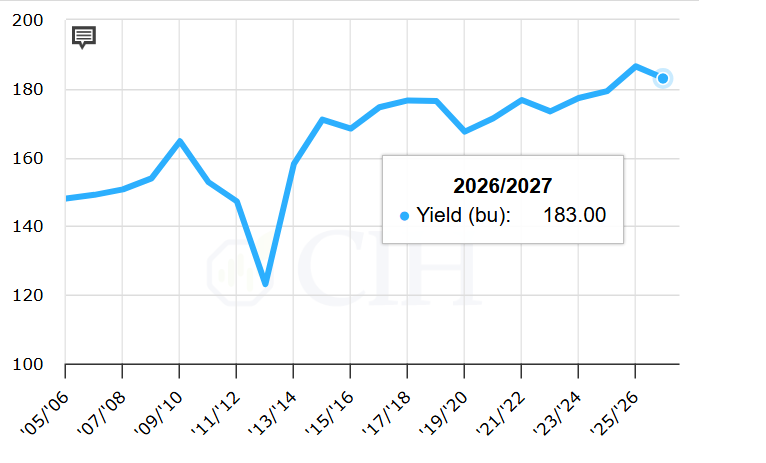
For corn, the 2025/26 balance sheet called for increased domestic use and ending stocks. Feed and residual use increased by 150 million bushels, offsetting the decrease in corn used for ethanol. This reflects the increase in Q3 disappearnce from last month’s report. Beginning stocks for 2026/27 were lowered to 2.02 billion bushels reflecting the changes in the 2025/26 carry over while production increased marginally to 16 billion bushels, at the top of the range for estimates (15.852 to 16.00 billion range). This increase reflects the marginal increase in planted area reported in last month’s Acreage report. As expected, yield was unchanged at 183.0 bushels per acre. Total use increased 50 million bushels, soley due to increased exports based on higher global demand. New crop ending stocks decreased 170 million bushels to 1.79 billion, below the range of estimates (1.990 to 2.151 billion range). The stocks-to-use ratio decreased 1.09 percent to 11.01 percent.
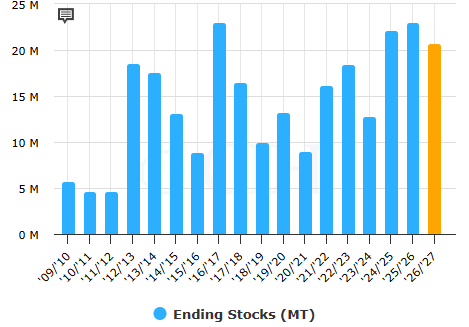
Globally, 2026/27 beginning stocks, production domestic total and ending stocks decreased as imports and domestic feed increased. Beginning stocks decreased in Ukraine and Russia. Production is forecast down to 1.297 billion metric tons, a slight decrease from the June report. Imports increased 4.37 million to 2.04 billion metric tons, reflecting increased demand from the E.U. The E.U.’s production estimate decreased 3.93 million metric tons due to worsening drought in its major growing areas like France. Ending stocks decreased 5.96 million metric tons to 275.26 million metric tons, in line with the range of analysts’ pre-report estimates (271.0 to 283.0 million range).
Q3 Usage
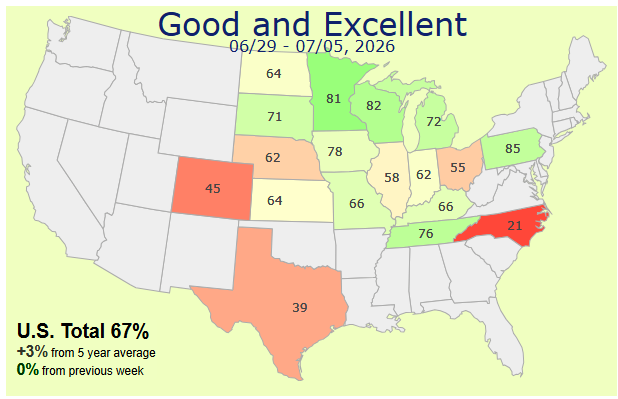
Corn conditions have stayed neutral in the U.S. over the last week but ahead of the five-year average:
Domestic stocks to use ratio:
Major Exporters ending stocks:
Soybeans
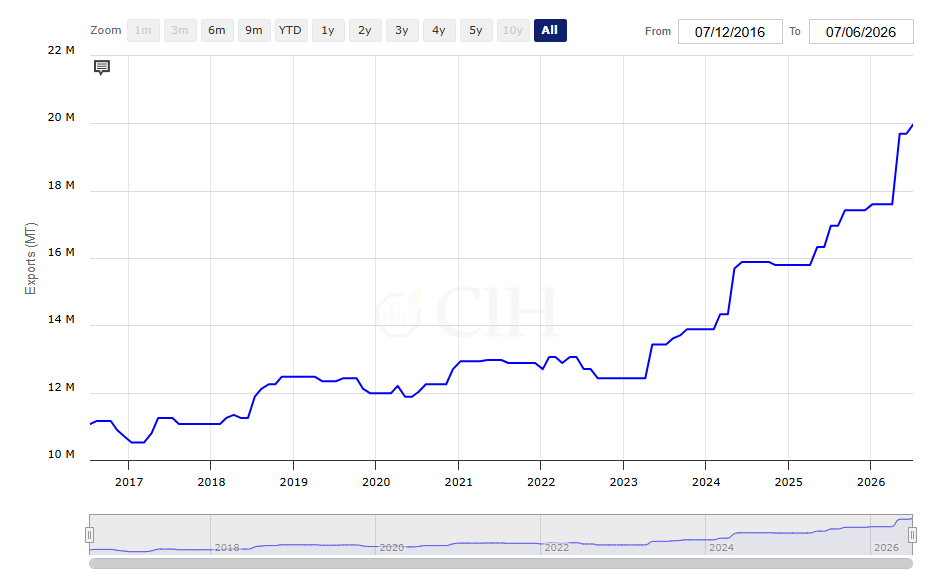
For soybeans, the domestic 2026/27 balance sheet called for increased beginning stocks, production, exports, and use. Soybean production was pegged at 4.475 billion bushels, slightly above the average trade estimate of 4.457 billion bushels but within the range (4.430 to 4.481 billion range). This change reflects higher planted and harvested acres released in last month’s Acreage report. The soybean yield forecast is unchanged at 53.0 bushels per acre. Soybean crush remains unchanged for both the 2025/26 and 2026/27 crop years with offsetting changes in soybean meal demand. Soybean exports were raised 30 million bushels with increased supply and stronger demand. Likewise, Soybean meal exports were raised by 300,000 short tons to 22 million short tons. Ending stocks were left unchanged at 310, within the range of estimates (270 to 358 million).
Global 2026/27 forecast called for higher production, increased exports and crush and lower ending stocks. Global production reflects increased production in the U.S. Brazilian production was kept unchanged from June, but exports were increased 500 thousand metric tons, resulting in lower ending stocks. Chinese imports are forecast higher by 1 million metric tons, due to an increase in domestic crush. The E.U. decreased its production marginally, reflecting a lower ending stock estimate of 1.46 million metric tons. Global ending stocks are pegged at 124.17 million metric tons, below the average pre-report estimate of 125.2 but within the expected range (124 to 126.2 million).
Soybean meal exports reflecting WASDE estimate:
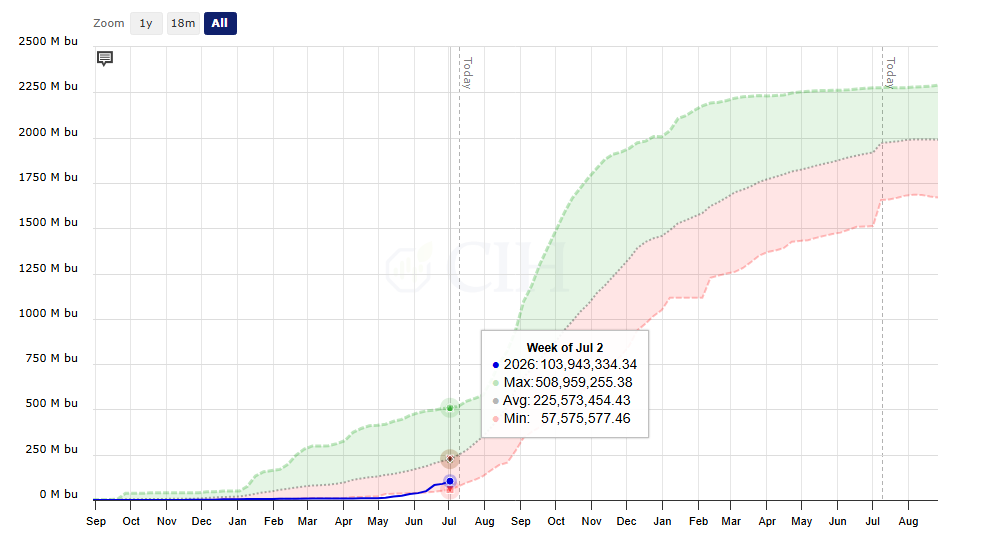
New crop soybean total commitments as of July 2:
Wheat
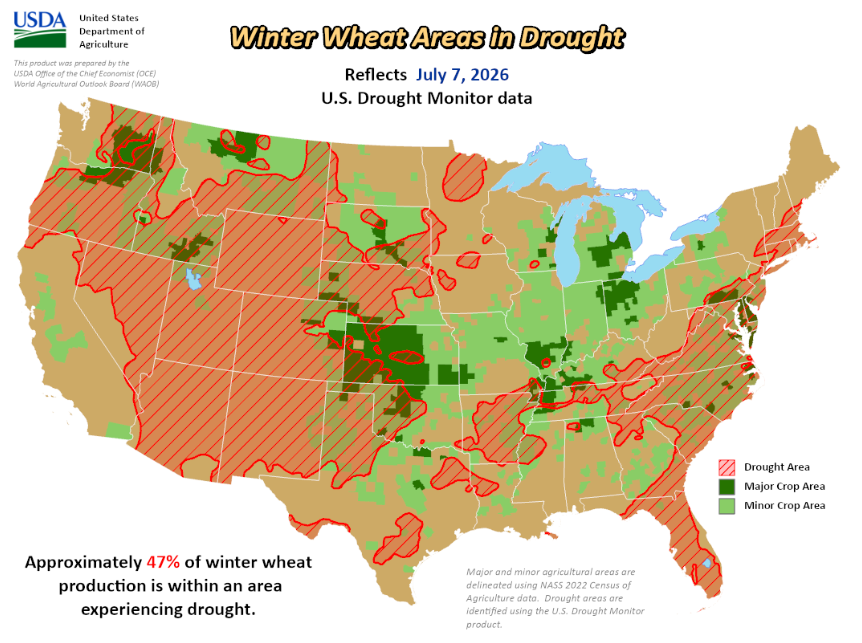
For wheat, the domestic 2026/27 balance sheet called for lower supplies, unchanged domestic use and exports, and smaller ending stocks. Pegged at 1.536 billion bushels, production was slightly above analysts’ average pre-report estimate of 1.524 billion bushels (1.498 to 1.568 billion range). If realized, this would be the lowest wheat production since 1970/71. The all-wheat yield increased by 0.9 bushels to 47.9 bushels per acre. Winter wheat production is lowered to 990 million, entirely due to reductions in Hard Red Winter and Soft Red Winter as 47 percent of winter wheat area is affected by drought. For the 2025/26 crop year, Hard Winter wheat production was pegged at 804, compared to the 471 million bushels expected for the 2026/27 crop. All-wheat ending stocks are projected at 722 million bushels, in the range of pre-report estimates (680 to 744 million). The stocks-to-use ratio decreased to 38.53 percent.
The global balance sheet called for reduced supplies, higher consumption and trade, and lower ending stocks. Ukraine increased production to 24 million metric tons, while Canada saw a decrease in production based on Statistics Canada’s Principal Field Crops Area report. World trade increased 1.1 million metric tons to 213 million as Argentina, Russia and Ukraine increases exports, offsetting the marginal decrease in Canada’s exports. The Middle East and Southeast Asia increased demand marginally. Ending stocks are projected at 272.84 million metric tons, in line with the range of estimates (270 to 275.1 million).
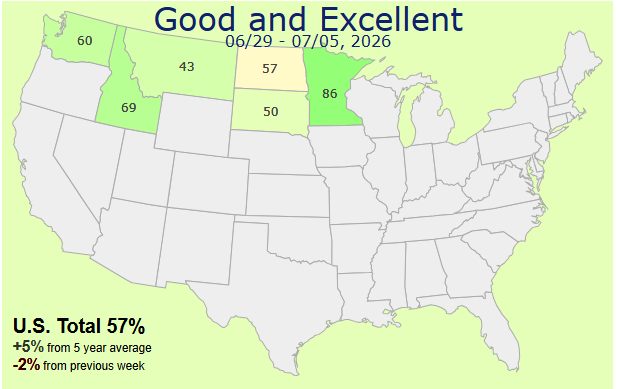
Spring wheat conditions as of July 5:
Winter wheat areas impacted by drought:
Major exporter ending stocks expected to decrease: