August 12, 2026

This report was deemed supportive-to-friendly for corn, wheat, and soybeans. The August WASDE presents the first survey-based yield forecasts for corn and soybeans, with objective field observations occurring in the coming weeks. The planted acreage changes in this report are directly linked to acreage reported by producers in compliance with FSA eligibility requirements which includes the detailing of all crop acreage, land use, and planting dates. Both yield and area are still subject to change in subsequent WASDE updates. Market participants will continue to debate the final size of this year’s harvest, but attention also remains fixed on demand, which is strong for both corn and soybeans. The war in Eastern Europe and the Middle East pose serious disruptions to world trade and adds risk premium.
Corn
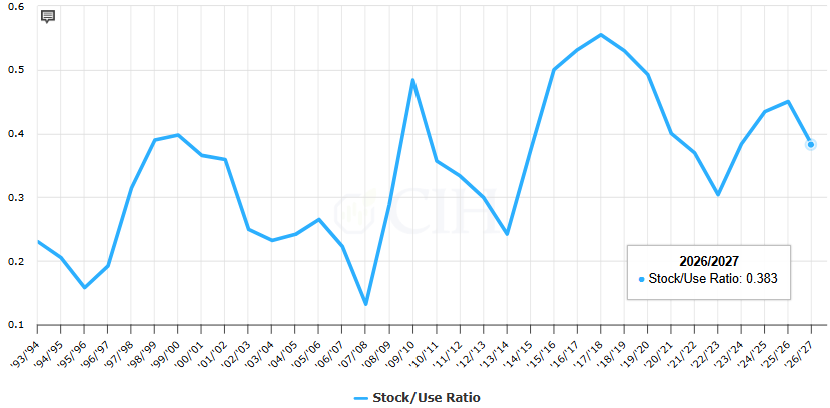
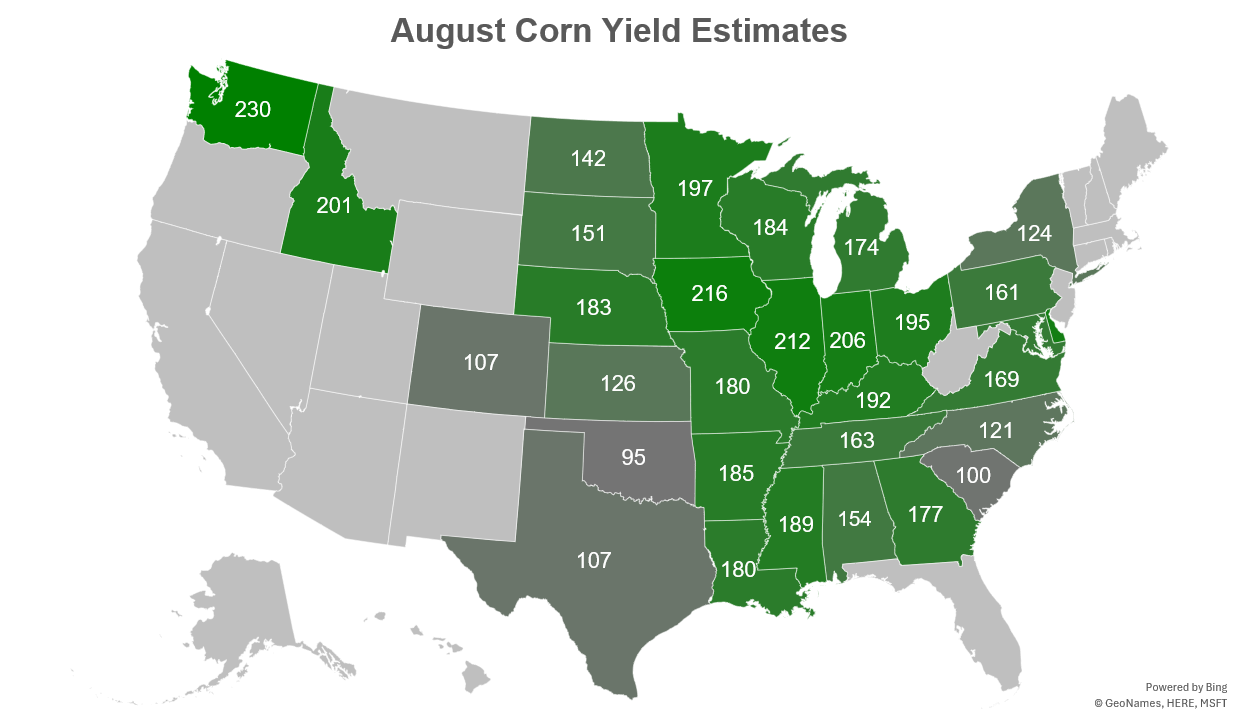
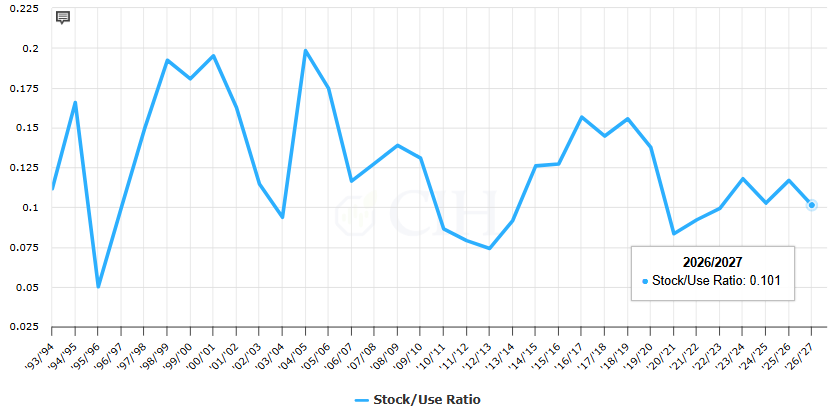
For corn, the 2025/26 balance sheet called for increased exports to 3.40 billion bushels, something the market had been anticipating for some time. For the 2026/27 balance sheet, production is raised marginally but more than offset by increased demand and smaller beginning stocks. Planted area is increased 1.4 million acres to 96.7 million, while harvested area is raised 1.2 million acres to 88.6 million. Offsetting the area increase is a lower expected yield of 180.7 bushels per acre, down 2.3 bushels per acre from last month’s forecast. The combination increases this year’s expected production by 13 million bushels to 16.013 billion bushels. With the lower beginning stocks and slight increase in production, total supplies are forecast down 62 million bushels from last month. On the demand side, 2026/27 exports are forecast 75 million bushels higher to 3.275 billion bushels, justified by, “increased global demand and constrained exports for Ukraine.” New crop ending stocks are forecast at 1.653 billion bushels, down 137 million from last month, and 292 million bushels (-15%) lower than last year. The stocks-to-usage ratio is projected tighter at 10.12% from 11.01% last month.
Globally, 2026/27 ending stocks are expected to be slightly lower than last month at 274.66 MMT, down 600,000 MT. Brazil’s balance sheet tightened due to an increase in domestic consumption that has been fueled by increased use for ethanol production. The main adjustments were to Ukraine and Russian production and exports as well as EU production. Ukraine and Russian production are forecast higher by 1.8 and 1.4 MMT, respectively. While not directly mentioning the recent port attacks in the corn commentary, USDA lowered Ukrainian exports 1 MMT to 22 MMT and Russian exports down 200,000 MT to 3.8 MMT. EU production is lower due to the extreme heat and dry conditions and is now forecast at 50.2 MMT, down 3.58 MMT from last month. EU imports are forecast to increase 1.0 MMT to 23.5 MMT.
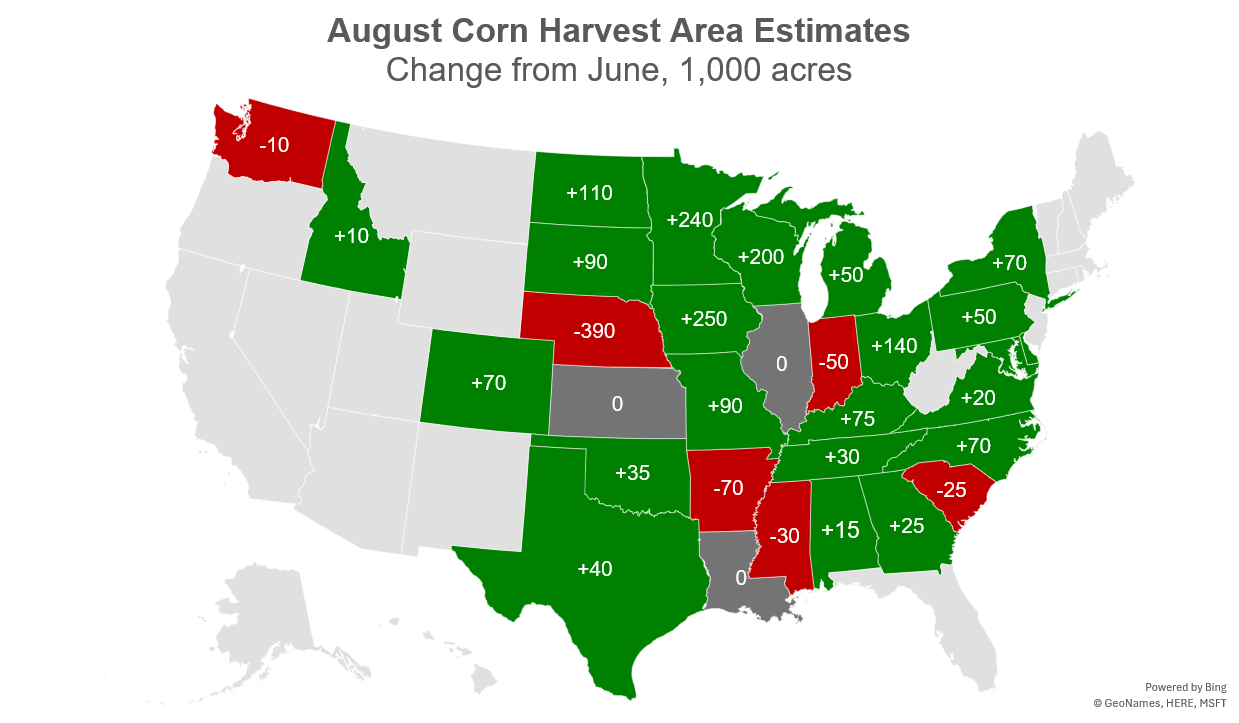
Corn Acreage Change from June Acreage Report:
August Corn Yield Estimates by State:
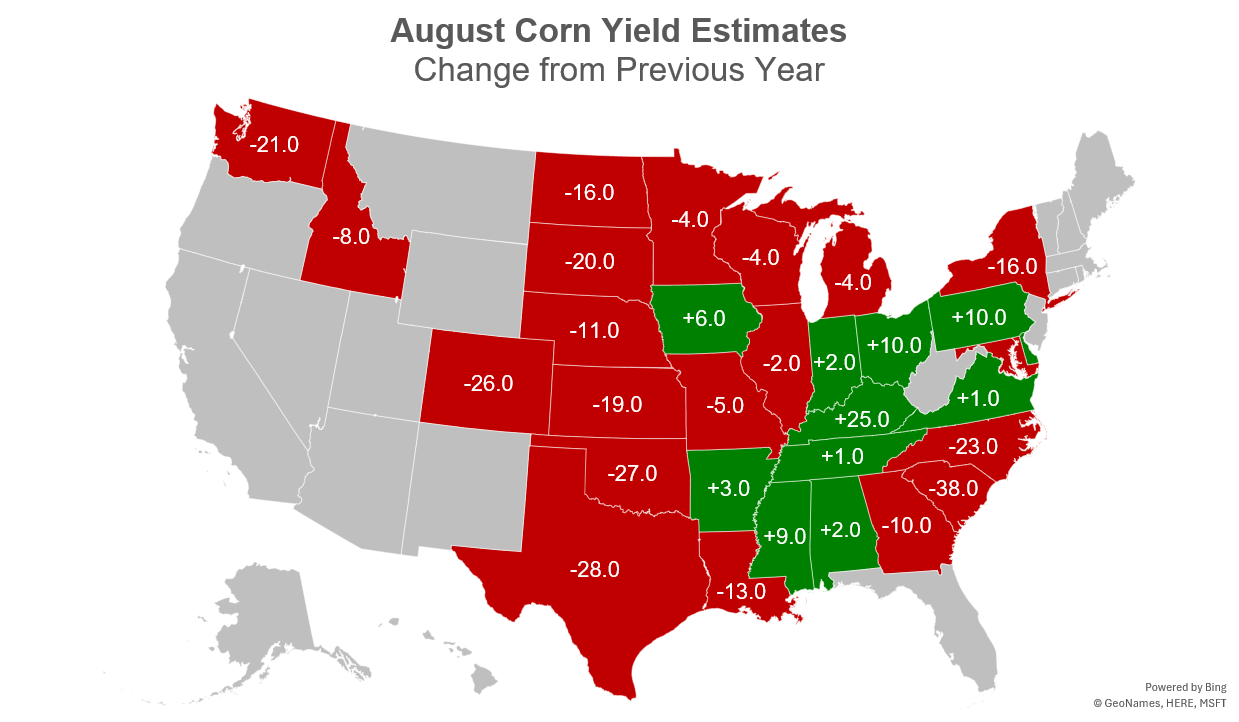
August Corn Yield Estimates Y/Y Difference:
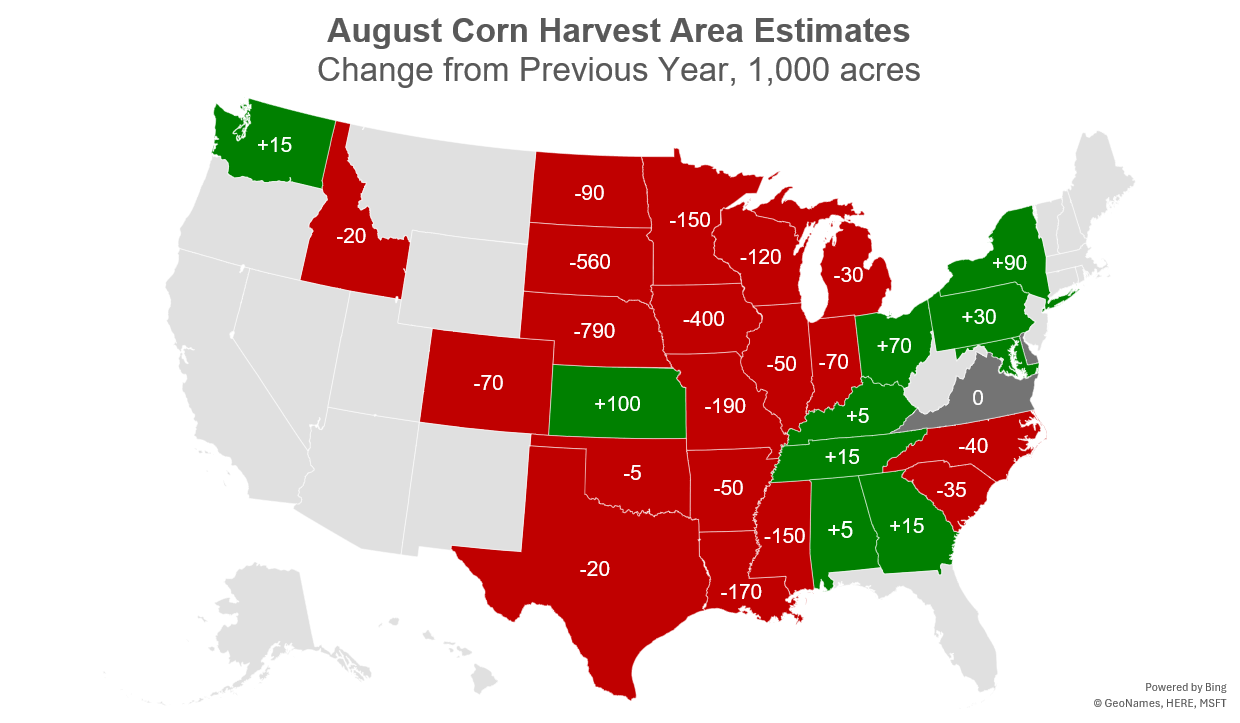
Corn Harvested Acreage Y/Y Change:
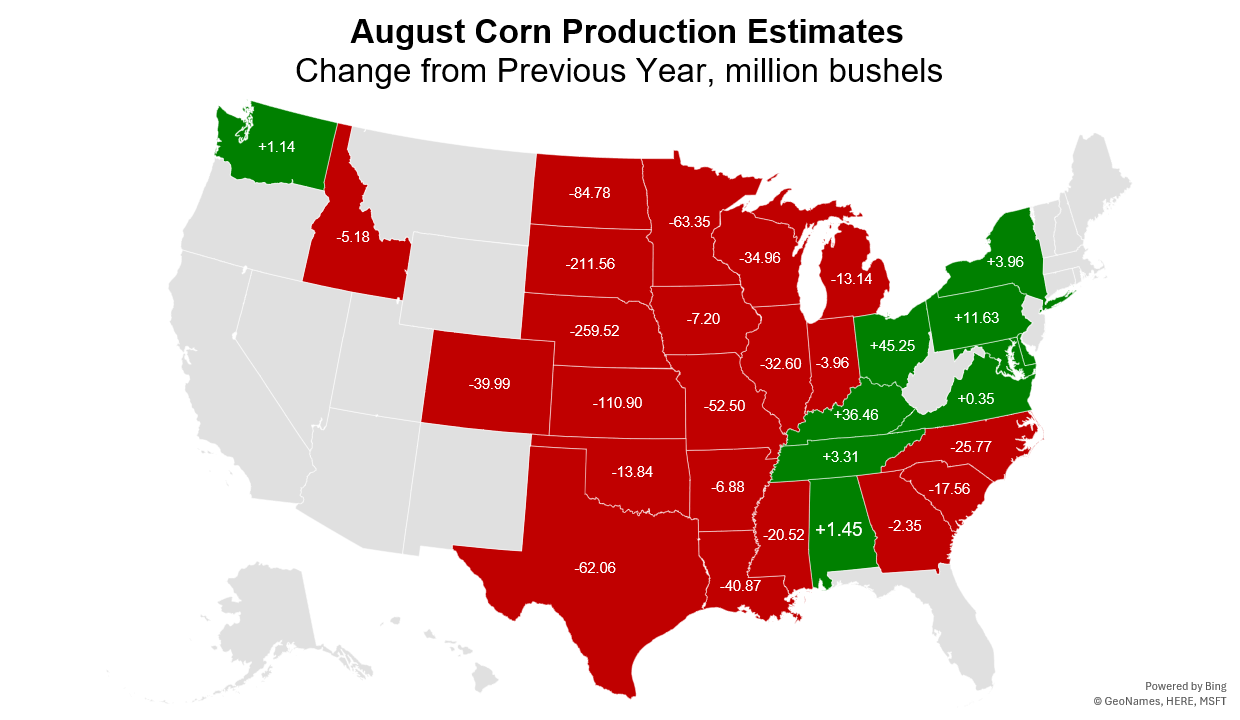
August Corn Production Estimates Y/Y Difference:
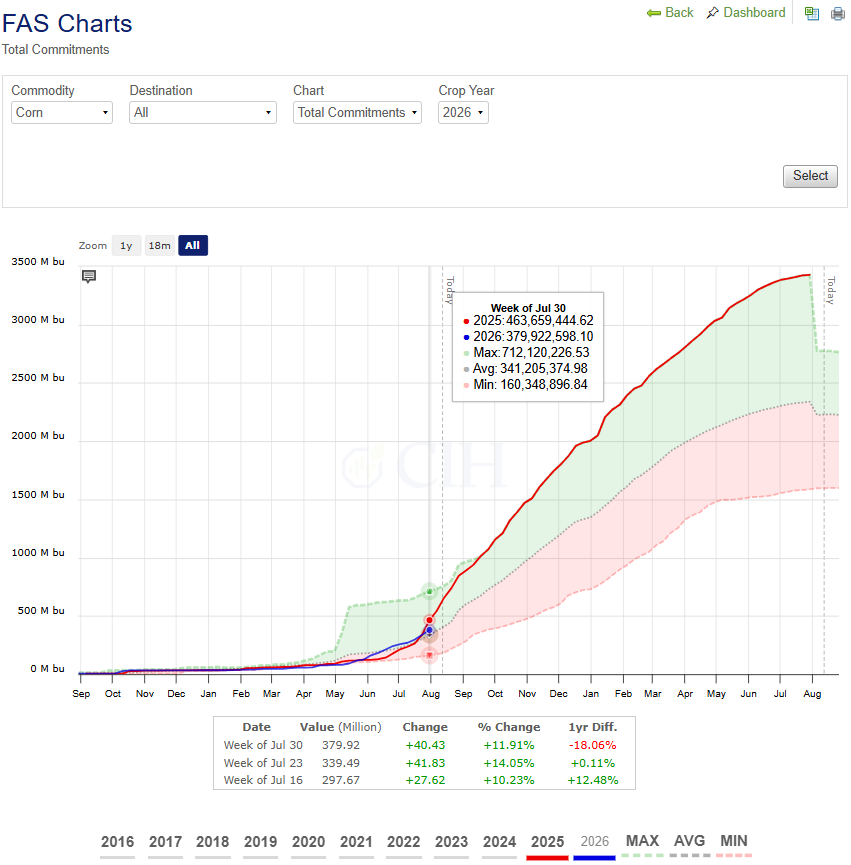
2026/27 Total Export Commitments compared to 2025/26 at this point:
Domestic stocks to use ratio:
Soybeans
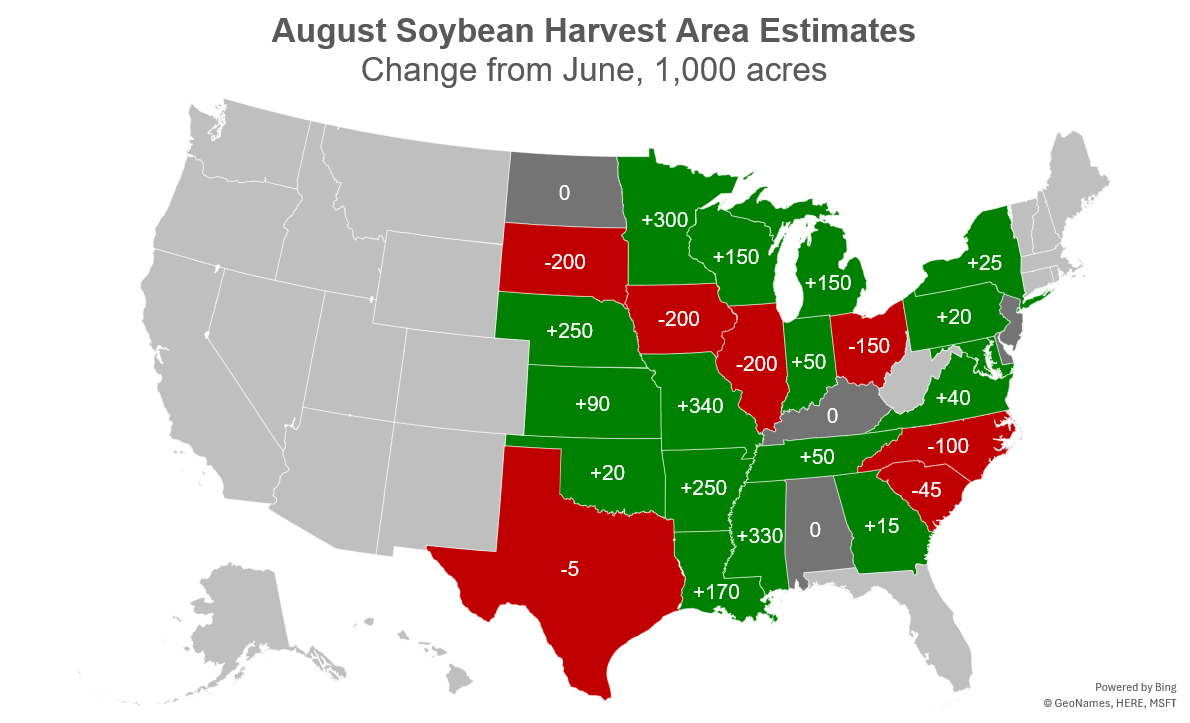
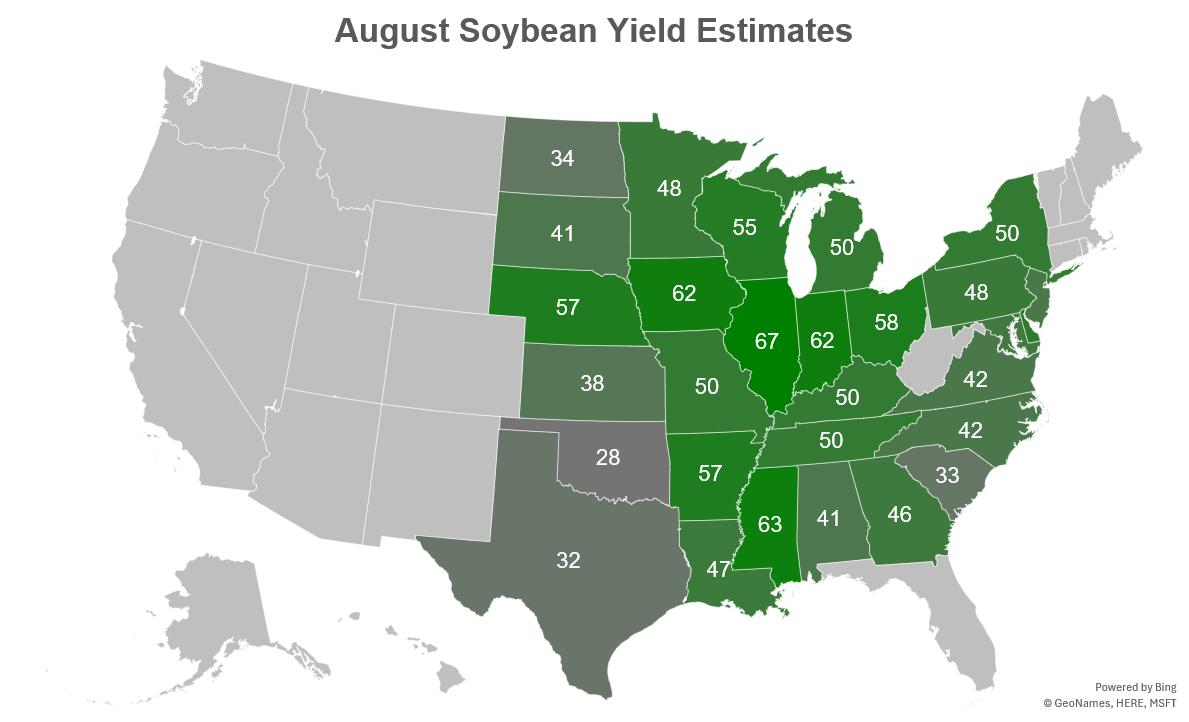
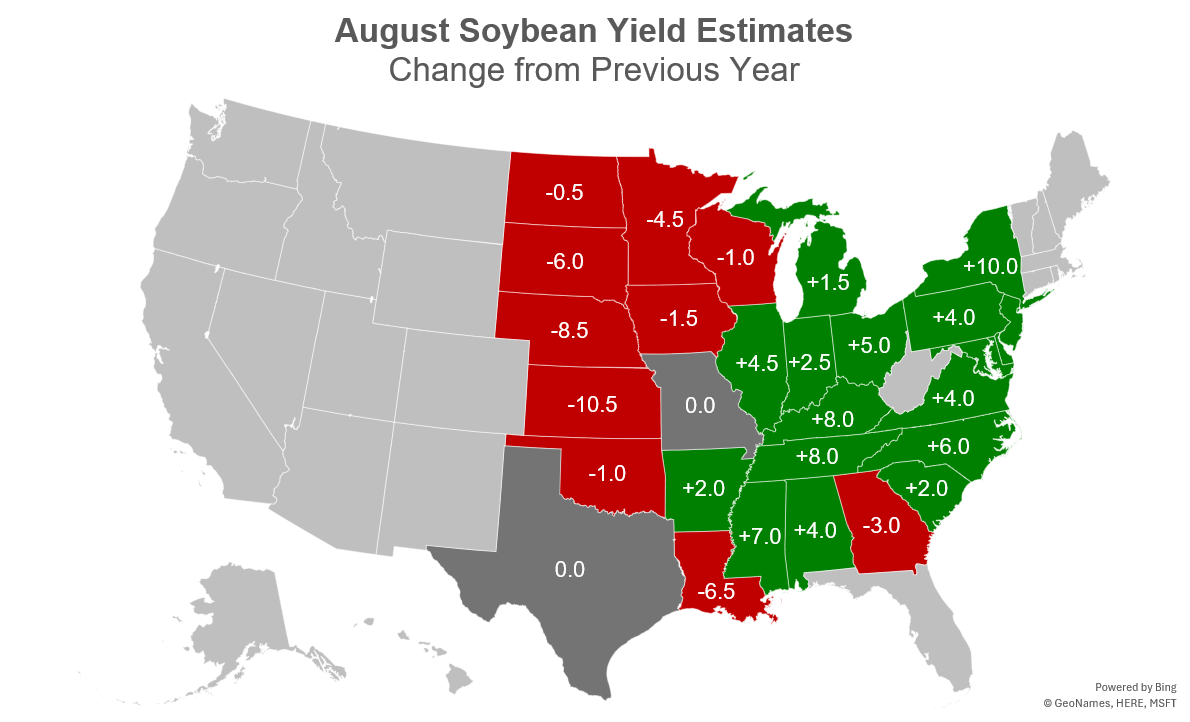
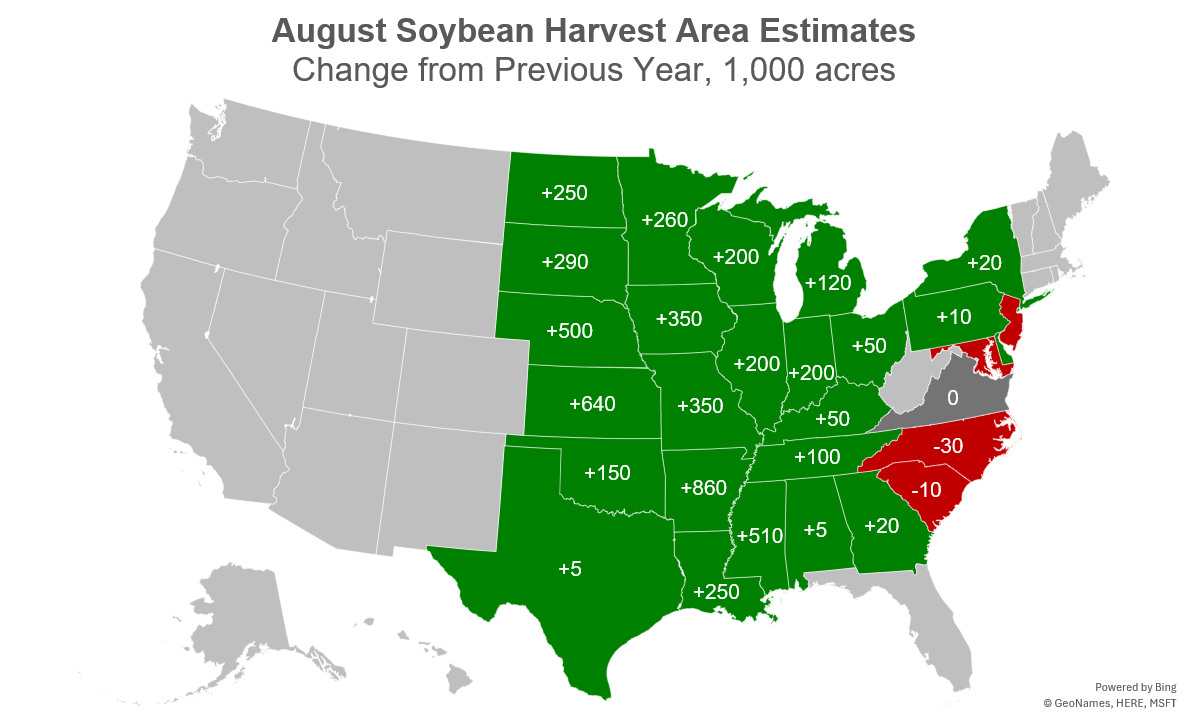
For soybeans, the domestic 2026/27 balance sheet called for lower beginning stocks, larger production, and larger crush use. Crush for 2025/26 was raised 5 million bushels to 2.655 billion bushels reflecting the current pace to date. Planted area is increased 1.4 million acres to 86.8 million, while harvested area is raised 1.4 million acres to 85.8 million. Offsetting the area increase is a lower expected yield of 52.7 bushels per acre, down 0.3 bushels per acre from last month’s forecast. The combination increases this year’s expected production by 44 million bushels to 4.519 billion bushels. With lower beginning stocks marginally offsetting the increase in production, total supplies are forecast up 39 million bushels from last month. On the demand side, 2026/27 crush is forecast 30 million bushels higher to 2.78 billion bushels due to,
“…robust crush margins and stronger demand for both soybean meal and oil. Soybean meal exports are raised by 0.7 million short tons to 22.7 million, reflecting strong global demand and increased to domestic use and imports for both 2025/26 and 2026/27 in several markets, including the Philippines, Mexico, Thailand, Turkey, the EU, and Ecuador. U.S. soybean oil domestic use is raised following higher demand in the prior marketing year.”
New crop ending stocks are forecast at 320 million bushels, up 10 million from last month. The stocks-to-usage ratio is projected at 7.03% from 6.86% last month.
No major changes were made to the global balance sheet forecast.
Soybean Acreage Change from June Acreage Report:
August Soybean Yield Estimates by State:
August Soybean Yield Estimates Y/Y Difference:
Soybean Harvested Acreage Y/Y Change:
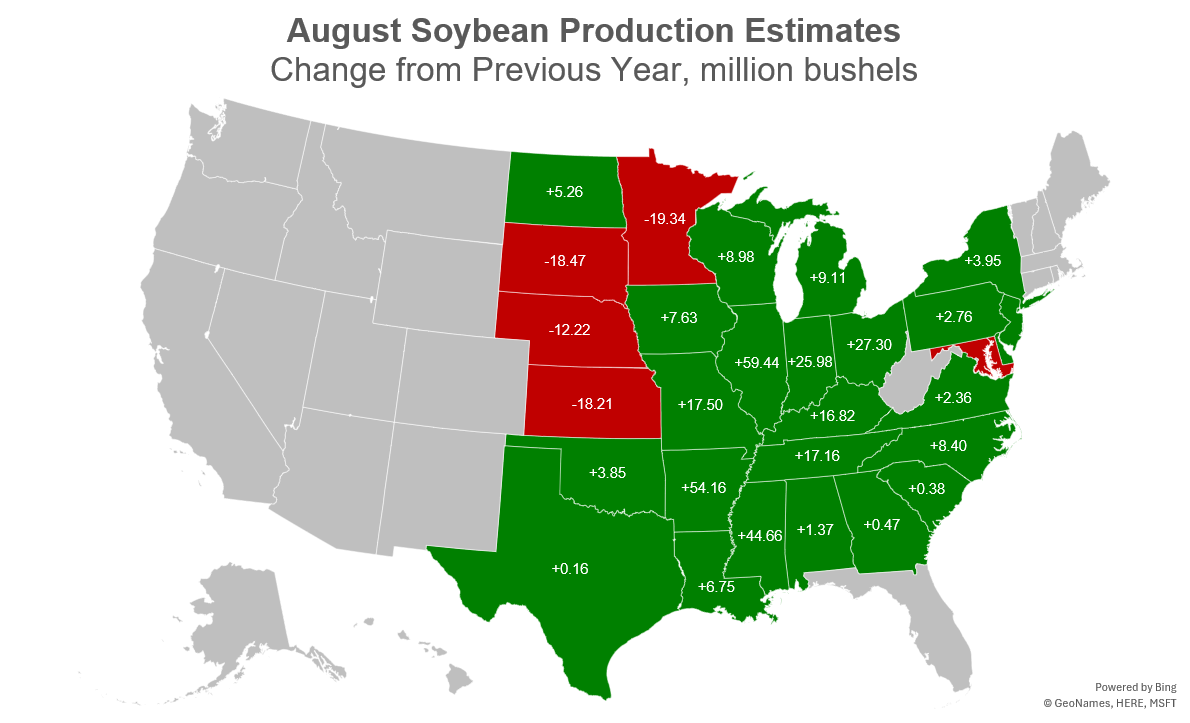
August Soybean Production Estimates Y/Y Difference:
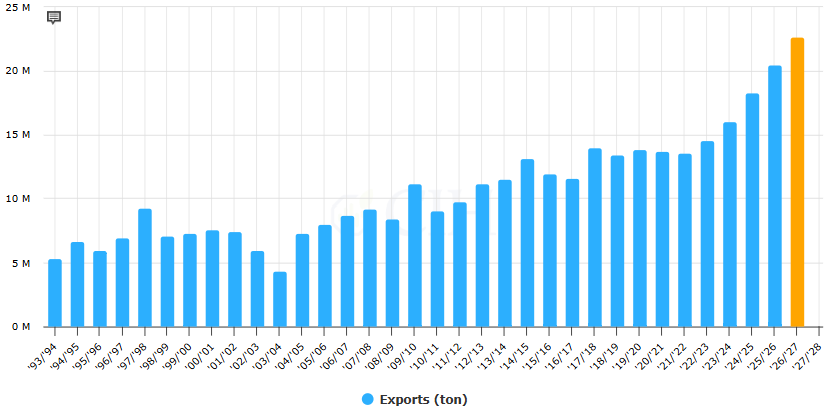
Soybean meal exports expected to remain strong:
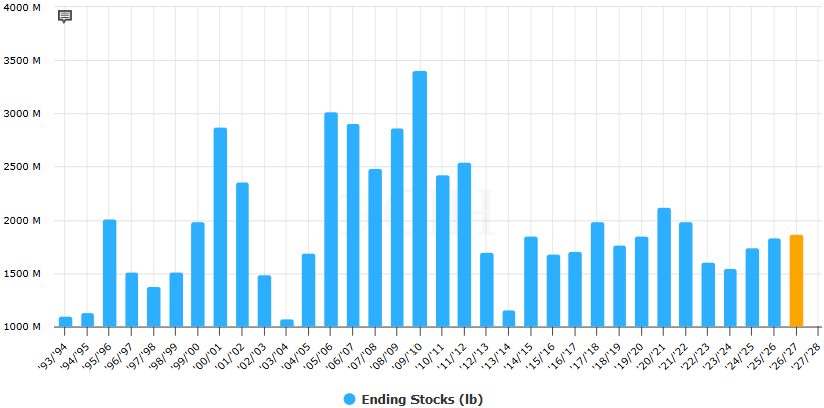
Soybean oil ending stocks:
Wheat
For wheat, the domestic 2026/27 balance sheet called for lower supplies, unchanged domestic use and exports, and smaller ending stocks. Production is forecast lower by 5 million bushels to 1.531 billion bushels on decreased harvested area and lower expected yield. With no other changes to the balance sheet, ending stocks are forecast at 717 million bushels, down 5 million from last month. Of note, the projected 2026/27 season-average farm price was increased $0.20 per bushel to $6.20. USDA states the increase is due to, “…a lower stocks-to-use ratio and expectations for futures and cash prices for the remainder of the marketing year.”
The global balance sheet pegged ending stocks nearly unchanged from last month at 273.25 MMT, up from 272.84 last month. USDA mentioned production issues in the EU, UK and Brazil and cited the prolonged high temperatures during grain fill impacting the European crop. USDA expects EU feed use to increase with shrinking corn supplies. Impacts from the Ukraine/Russia conflict were also addressed, stating, “Russia and Ukraine exports are lowered on logistical disruptions arising from the increased conflict between the two countries in the Sea of Azov and the Black Sea.” Exports for Russia are projected down 1.5 MMT to 46 MMT and down 1.0 MMT for Ukraine to 13.5 MMT. USDA forecasts Canadian and Kazakhstan exports to both increase 1.0 MMT as a result.
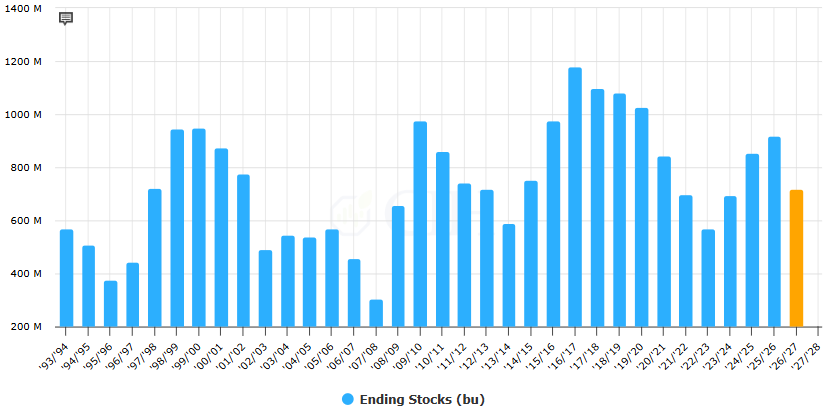
Wheat ending stocks down sharply from last year (6th lowest in last 20 years):
Wheat stocks-to-usage ratio still comfortable: