October 09, 2026

This report reflected a larger supply for corn, lower global exports for wheat, and record domestic production for soybeans, in line with analysts’ pre-report estimates. This report incorporated last month’s Grain Stocks estimates into its balance sheet. Market attention will continue to focus on domestic harvest and global trade.
Corn
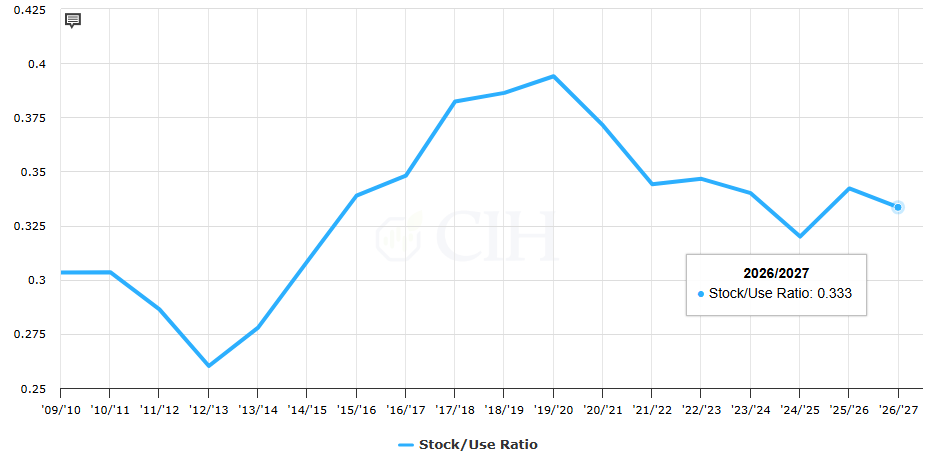
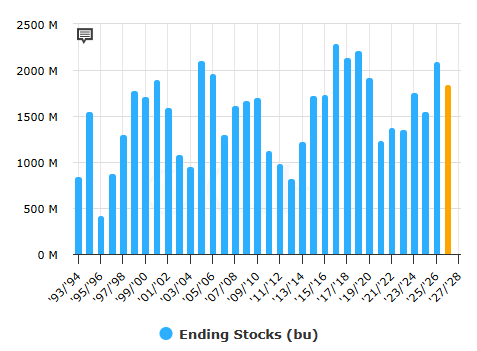
For corn, the 2026/27 balance sheet called for larger supplies, exports, domestic use, and ending stocks. Total domestic supply increased by 407 million to 18.154 billion bushels, accounting for an increase of 173 million bushels in beginning stocks based on the September 30 Grain Stocks Report and a 2.7-bushel increase to yield. USDA pegged yield at 181.2 bushels/acre, at the top end of pre-report estimates (173.2 to 182.1 range). The increase of supply led to an increase of 125 million bushels across total use. Feed and residual and ethanol/by product production saw an increase of 50 million bushels each while exports saw an increase of 25 million bushels. The total use category didn’t offset all the increase to supply, resulting in ending stocks increasing by 282 million bushels to 1.849 billion bushels, near the top range of pre-report estimates (1.522 to 1.895 range). The stocks-to-use ratio was raised to 11.34%.
Globally, 2026/27 ending stocks were raised by 8.3 MMT to 280.44 MMT, below the average pre-report estimate but within the range (273.0 to 310.5 range). This reflects an increase in beginning stocks for the United States and Argentina and increased production in the United States. Consumption saw a marginal decease reflecting a cut in major importers’ production to 110.47 MMT. USDA accounts for a 2.6 MMT cut to E.U. production due to the harvest results and revised government data.
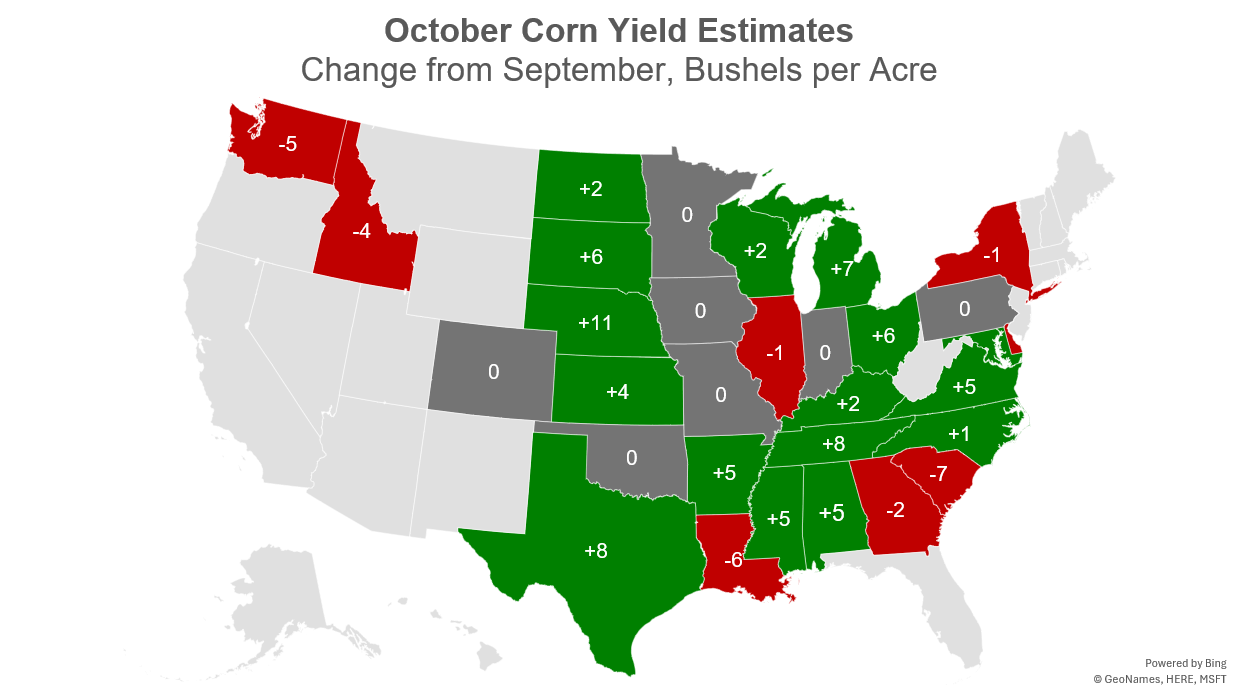
October Yield Changes:
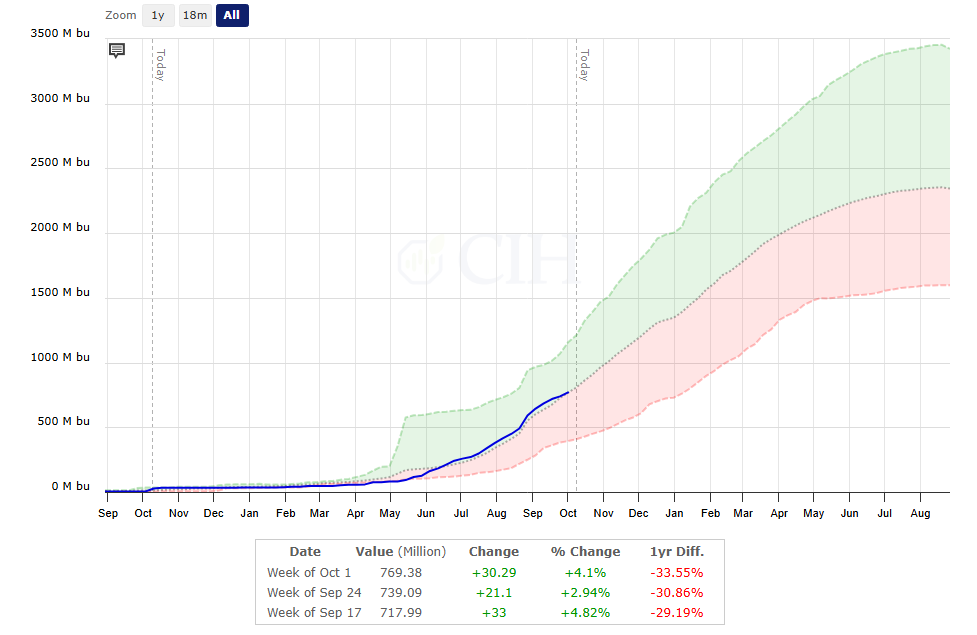
2026/27 Domestic Export Total Commitments as of October 1:
Domestic Ending Stocks:
Soybeans
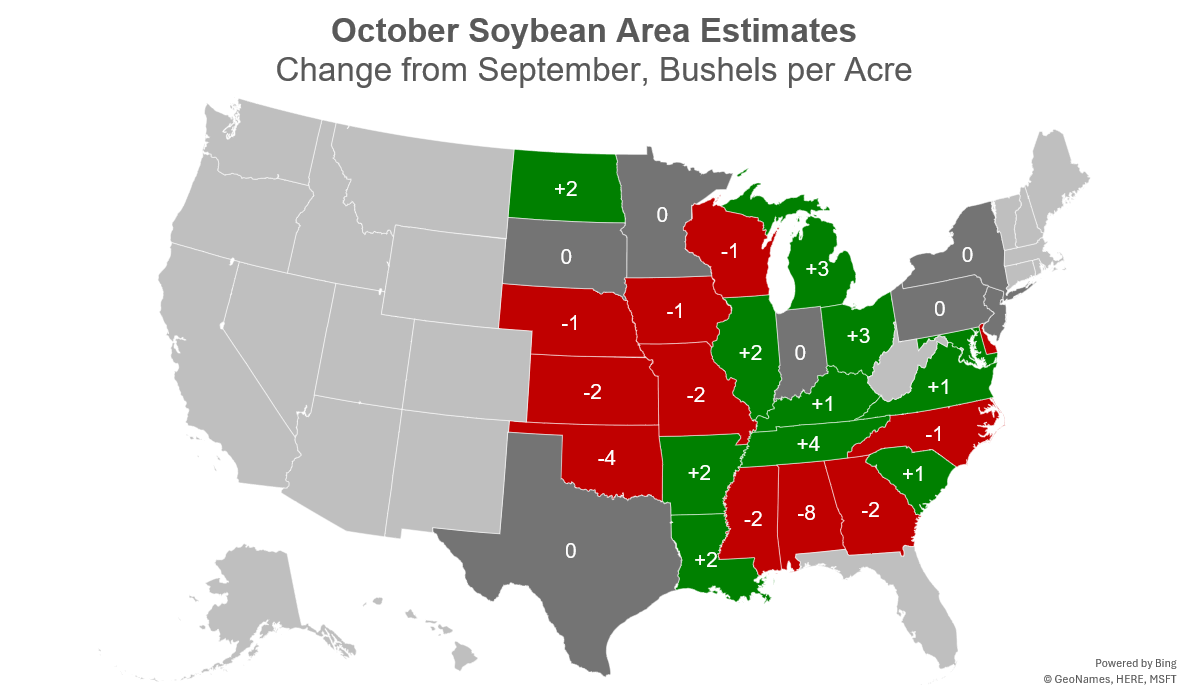
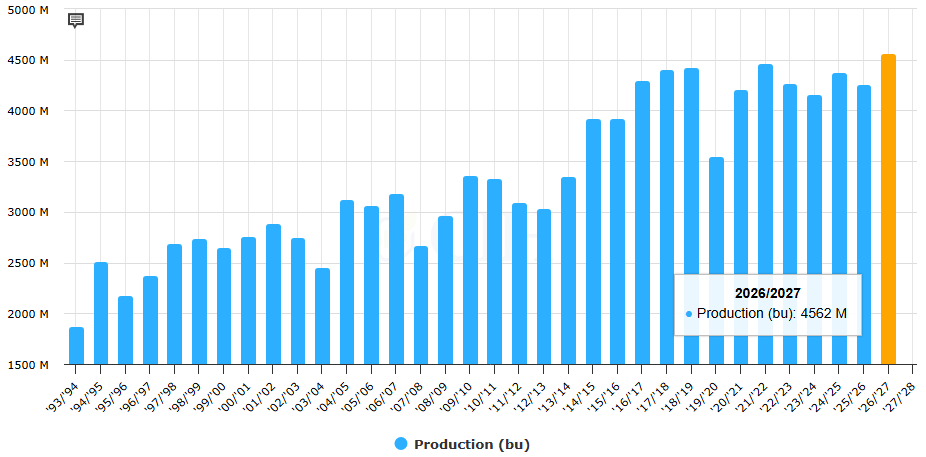
For soybeans, the domestic 2026/27 balance sheet called for an increase in yield to 53.1 bushels per acre, above the average pre-report estimate of 52.9 bushels but within the range (51.4 to 54.1 range). This sets a record productions at 4.562 billion bushels, up 27 million bushels from last month. Exports were raised by 10 million bushels to 1.695 billion. Residual use also increased by 1 million bushels to 39 million. Ending stocks were raised to 315 million bushels, above the average pre-report estimate of 311 million but within the range (245 to 358 range).
The global balance sheet was left essentially unchanged. Ending stocks are projected at 124.28 MMT, within the range of estimates (123.0 to 127.4 range).
October Yield Changes:
Domestic Soybean Production:
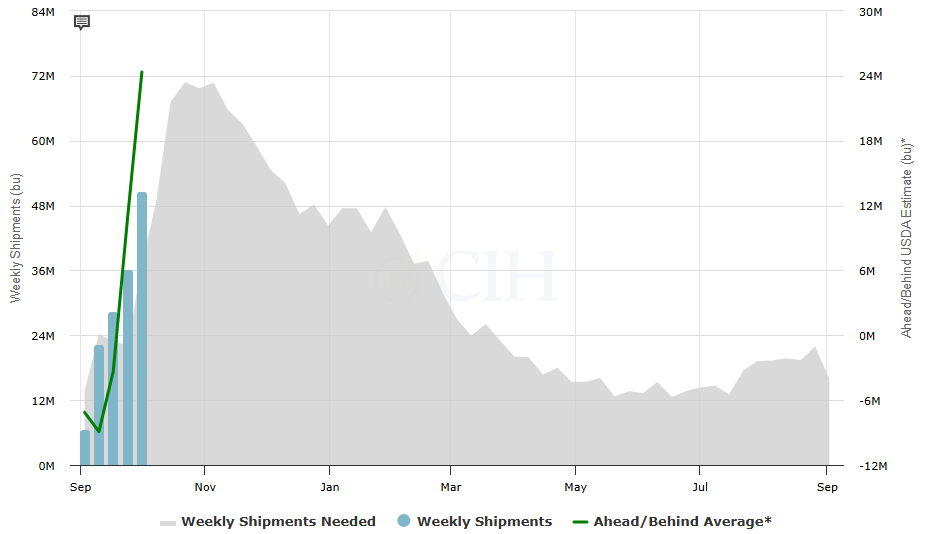
Domestic soybean export shipments are 24 million bushels ahead to meet USDA’s estimate:
Wheat
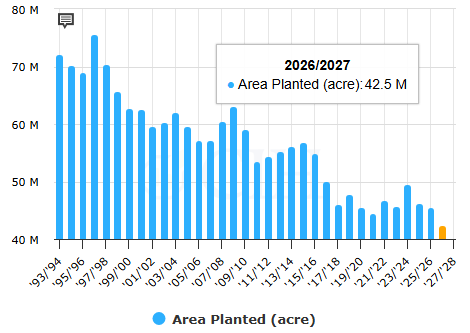
For wheat, the domestic 2026/27 balance sheet called for an increase in production of 3 million bushels as yield was raised to 48.1 bushels per acre. This remains the smallest domestic wheat production since 1970. Imports increased by 5 million to 145 million bushels, offsetting the marginal cut to harvested acres. Feed and residual use increased 10 million to 90 million bushels while exports were cut 25 million to 750 million bushels. The cut to exports raised ending stocks to 740 million bushels, above the average pre-report estimates but within the range of estimates (701 to 750 range).
The global balance sheet called for an increase to domestic feed use, reduced exports, and lower ending stocks. E.U. production was lowered marginally to 133 MMT, mostly on a reduction to Germany. The E.U. and China each reflected a 1 MMT increase in domestic feed use. Exports were cut by 3 MMT, reflecting reduction in Russia trade. Russian exports are projected the lowest in 5 years at 40 MMT with logistical disruptions caused by the continuing conflict in the Black Sea region reducing shipments to date, well below their long-term average. Global ending stocks are pegged at 276.04 MMT, below the average pre-report estimate of 280.4 but within the range of estimates (279.0 to 281.0) range.
Domestic Wheat Planted Area:
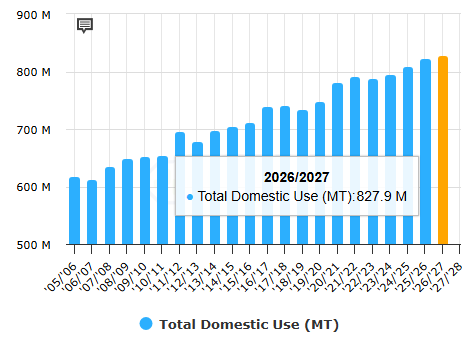
Global Total Domestic Use:
Global Stocks-to-Use ratio trimmed to 33.34%: