July 01, 2026

Strong margins persist despite a disappointing seasonal cutout rally
In this column, I typically focus on the fundamental drivers influencing hog producer profit margins. While aggregate open market margins for the next year have retreated from recent highs, they remain historically attractive, ranking near the 85th percentile of the past decade. Opportunities to protect profits over the next 12 months remain compelling.
In many respects, the current market environment is sending mixed signals. Wholesale pork values have struggled to gain traction despite the onset of grilling season, yet producer margins remain among the strongest of the past decade thanks in large part to lower feed costs. Understanding why those two realities can exist simultaneously, and how recent market volatility has created opportunities to improve existing protection, has become a common theme in conversations with producers.
Recent conversations with producers have centered on a handful of recurring themes, including the sluggish pork cutout, emerging trends in USDA wholesale pork data, and opportunities created by recent volatility to strengthen margin protection.
Reading the Wholesale Market
Interest in pork carcass cutout calculations, the purpose of various USDA wholesale pork reports, and recent market trends has increased noticeably. Given that it has been six years since our last update on the subject, now seems like an appropriate time for a refresher.
The renewed interest comes at a time when the pork cutout has failed to exhibit the seasonal strength typically associated with the heart of grilling season. The daily pork cutout value currently sits roughly 20% below year-ago levels and is little changed from where it began the year.
Several factors have contributed to the lackluster performance. Ample poultry supplies have provided consumers with a competitively priced protein alternative, while persistent inflationary pressures have continued to strain household budgets and limit discretionary spending. At the same time, relatively large weekly hog slaughter numbers have kept pork supplies readily available. Perhaps most notably, belly values (often a key driver of summer cutout strength) remain roughly 35% below year-ago levels, preventing the cutout from achieving the seasonal gains producers have come to expect.
Figure 1. 602 Pork Cutout Value
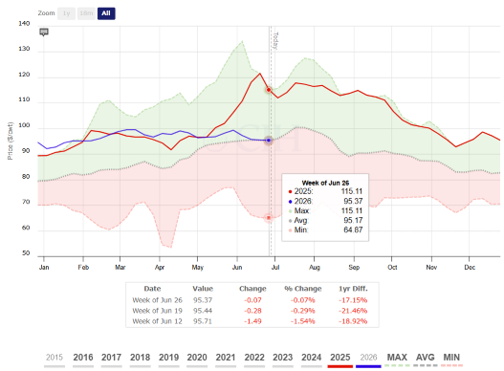
As a reminder, wholesale pork reporting began in 2013 at the request of industry participants. The pork carcass cutout value is an estimate of a hog carcass’s value based on the prices received for its individual components. USDA calculates the cutout using a standardized 215-pound carcass grading 55-56% lean, applying industry-average cut yields to prevailing market prices for sub-primal pork cuts.
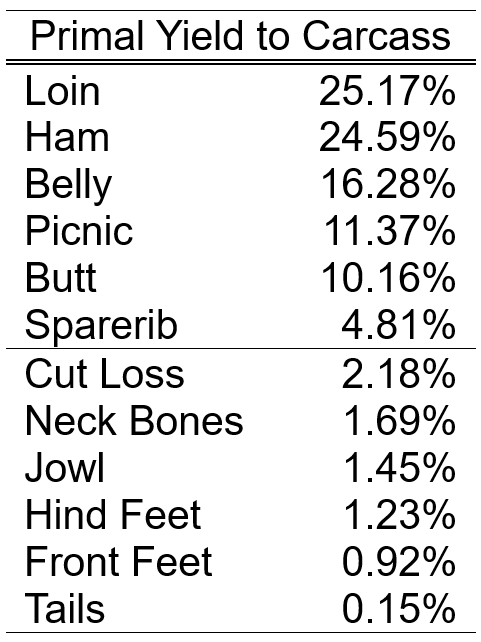
Put simply, prices for individual pork items are weighted according to their contribution to the carcass to determine primal values. Those primal values are then combined to arrive at an overall carcass-equivalent value. USDA surveys packers each July to evaluate whether yield assumptions remain representative of current industry conditions and updates them the following January when warranted.
Current yield assumptions are shown below. The loin accounts for the largest share of the cutout, followed closely by the ham, with the remaining primals contributing progressively smaller portions.
In addition to the daily report in the chart above, there are several weekly national pork reports we pay close attention to:
- Negotiated Sales (LM_PK610): price determined by seller-buyer interaction and agreement, scheduled for delivery not later than 14 days for boxed product and 10 days for combo products after the date of agreement.
- Formula Sales (LM_PK620): price is established in reference to publicly available quoted prices.
- Forward Sales (LM_PK630): agreement for sale of pork beyond the timeframe for a negotiated sale.
- Export Sales (LM_PK640): as its name implies, contains sales to export markets. Unlike the other three, however, this report does not include sales to Canada or Mexico.
- Specialty Pork (LM_PK650): provides aggregated wholesale pricing and volume data for specialty-market pork cuts (e.g., crate-free, antibiotic-free, color-graded, and organic programs).
Each report offers a unique perspective for producers attempting to gauge demand trends and develop a market outlook.
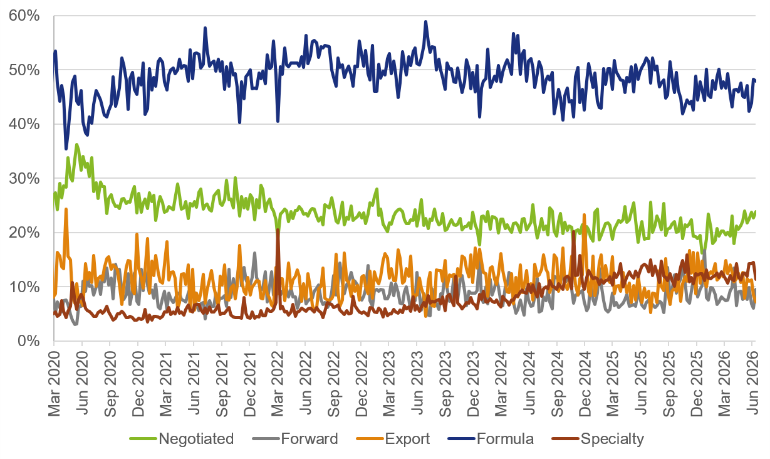
Several notable shifts have occurred over the past six years. Specialty pork volume has increased significantly, although it still represents a relatively small share of total reported volume.
Negotiated sales as a percentage of total wholesale volume have generally declined since the pandemic-era peak, though negotiated activity has trended modestly higher over the past six months.
Figure 2. Share of Reported Wholesale Pork Volume by Sales Type
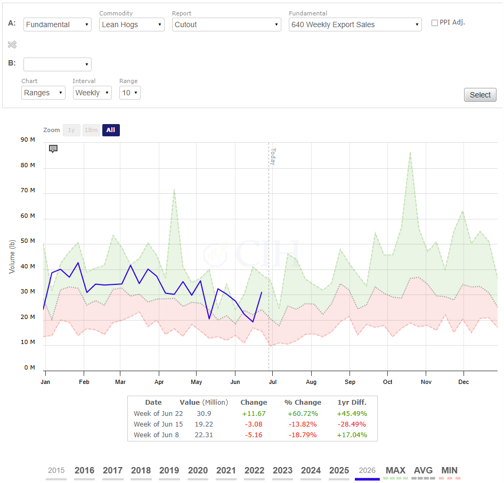
The LM_PK640 export report deserves particular attention because it provides an early indication of export demand trends well ahead of official U.S. Census Bureau data. Export volume has generally trended lower during the past quarter. While not necessarily unusual from a seasonal perspective, it remains a metric worth monitoring because the report often provides insight ahead of the FAS Weekly Export Sales data and can precede official trade figures by more than a month.
Figure 3. LM_PK640 Pork Weekly Export Sales Volume
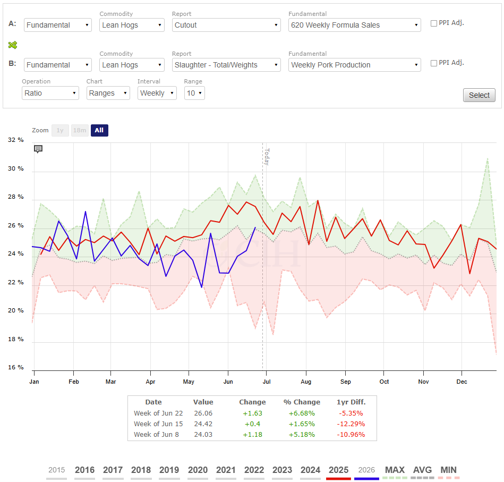
One final trend that may be contributing to the underwhelming cutout performance is the decline in formula sales as a share of pork production. As the largest wholesale category, the LM_PK620 report serves as a useful proxy for pork moving through established marketing channels. As shown in the chart below, formula volume as a percentage of production has recently fallen to or near non-COVID lows for much of the last several weeks.
When less product moves through formula arrangements, those pounds must ultimately find another outlet, often the negotiated market. The result is additional supply pressure on negotiated transactions and, potentially, a headwind to the seasonal cutout rally that producers typically expect during the summer months.
Figure 4. LM_PK620 Formula Volume as a Share of Pork Production
Managing Margins in a Fast-Moving Market
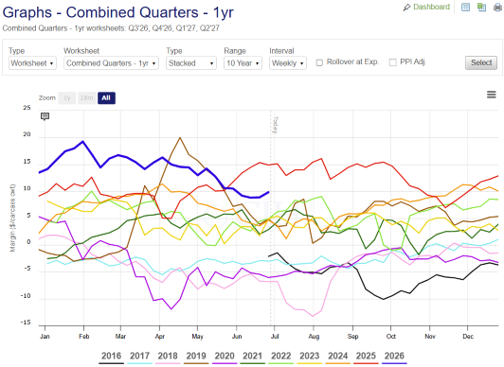
Open market margins are never static and vary considerably from one operation to the next. While margins for our demonstration operation have softened from recent highs, they remain historically attractive. More importantly, the volatility witnessed over the past several weeks has created opportunities to reposition protection and improve the quality of existing coverage.
Figure 5. Rolling 4 Quarters Margin Chart
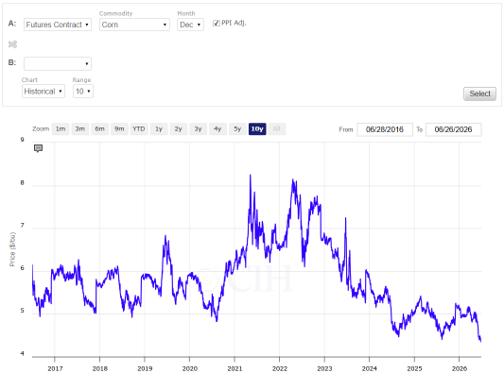
Lower feed costs have played a significant role in supporting forward profitability. New-crop December corn futures have fallen from above $5.00 per bushel in mid-May to around $4.40 just a few weeks later, driven largely by aggressive commodity fund liquidation. While seasonal weakness following planting is common, considerable uncertainty remains as the crop enters pollination and grain fill. Drought concerns across portions of the Western Corn Belt and excessive moisture in parts of the East serve as reminders that production expectations can change quickly. It would not take a substantial reduction in acreage or yield to tighten projected ending stocks and spark a meaningful rally in corn prices. When adjusted for inflation, today’s December corn futures represent one of the most attractive buying opportunities of the past decade. As a result, many clients have successfully transitioned from flexible feed coverage established earlier this year into more fixed positions through futures or cash contracts as the market declined.
Figure 6. December Corn Futures Price, Inflation Adjusted
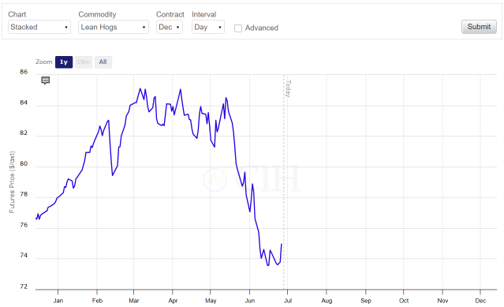
Weakness in lean hog futures has also contributed to the decline in open market margins, but it has simultaneously created adjustment opportunities for producers who entered the downturn with protection already in place. The chart below highlights the December lean hog futures contract, which has experienced significant pressure in recent weeks. For proactive producers, the resulting hedge gains can be used to replace more rigid coverage with alternatives that preserve upside opportunity while maintaining downside protection. While there are numerous ways to take advantage of previously established hedges, common approaches have included relying on options, Livestock Risk Protection (LRP), or Livestock Gross Margin (LGM) coverage.
Figure 7. December 2026 Lean Hog Futures
The corn and lean hog markets have moved dramatically since World Pork Expo, underscoring just how quickly margin opportunities can change. The producers who consistently capture attractive margins are rarely those who predict every market move correctly; rather, they are the ones who have a plan in place before volatility arrives. Managing both feed costs and revenue risk, routinely evaluating adjustment opportunities, and remaining disciplined in execution can help transform favorable market conditions into realized financial results. In a year where margins remain among the strongest of the past decade, protecting opportunity may be just as important as identifying it.
Trading futures and options carries a risk of loss. Past performance is not indicative of future results. Insurance coverage cannot be bound or changed via phone or email. CIH is an equal opportunity employer and provider. © 2026 CIH. All rights reserved.